Employee Management Platform
A staffing tool for teams that spread the same people across several projects at once. Drag someone into a role, watch their allocation total update, and catch anyone over capacity before it turns into a problem.
Overview
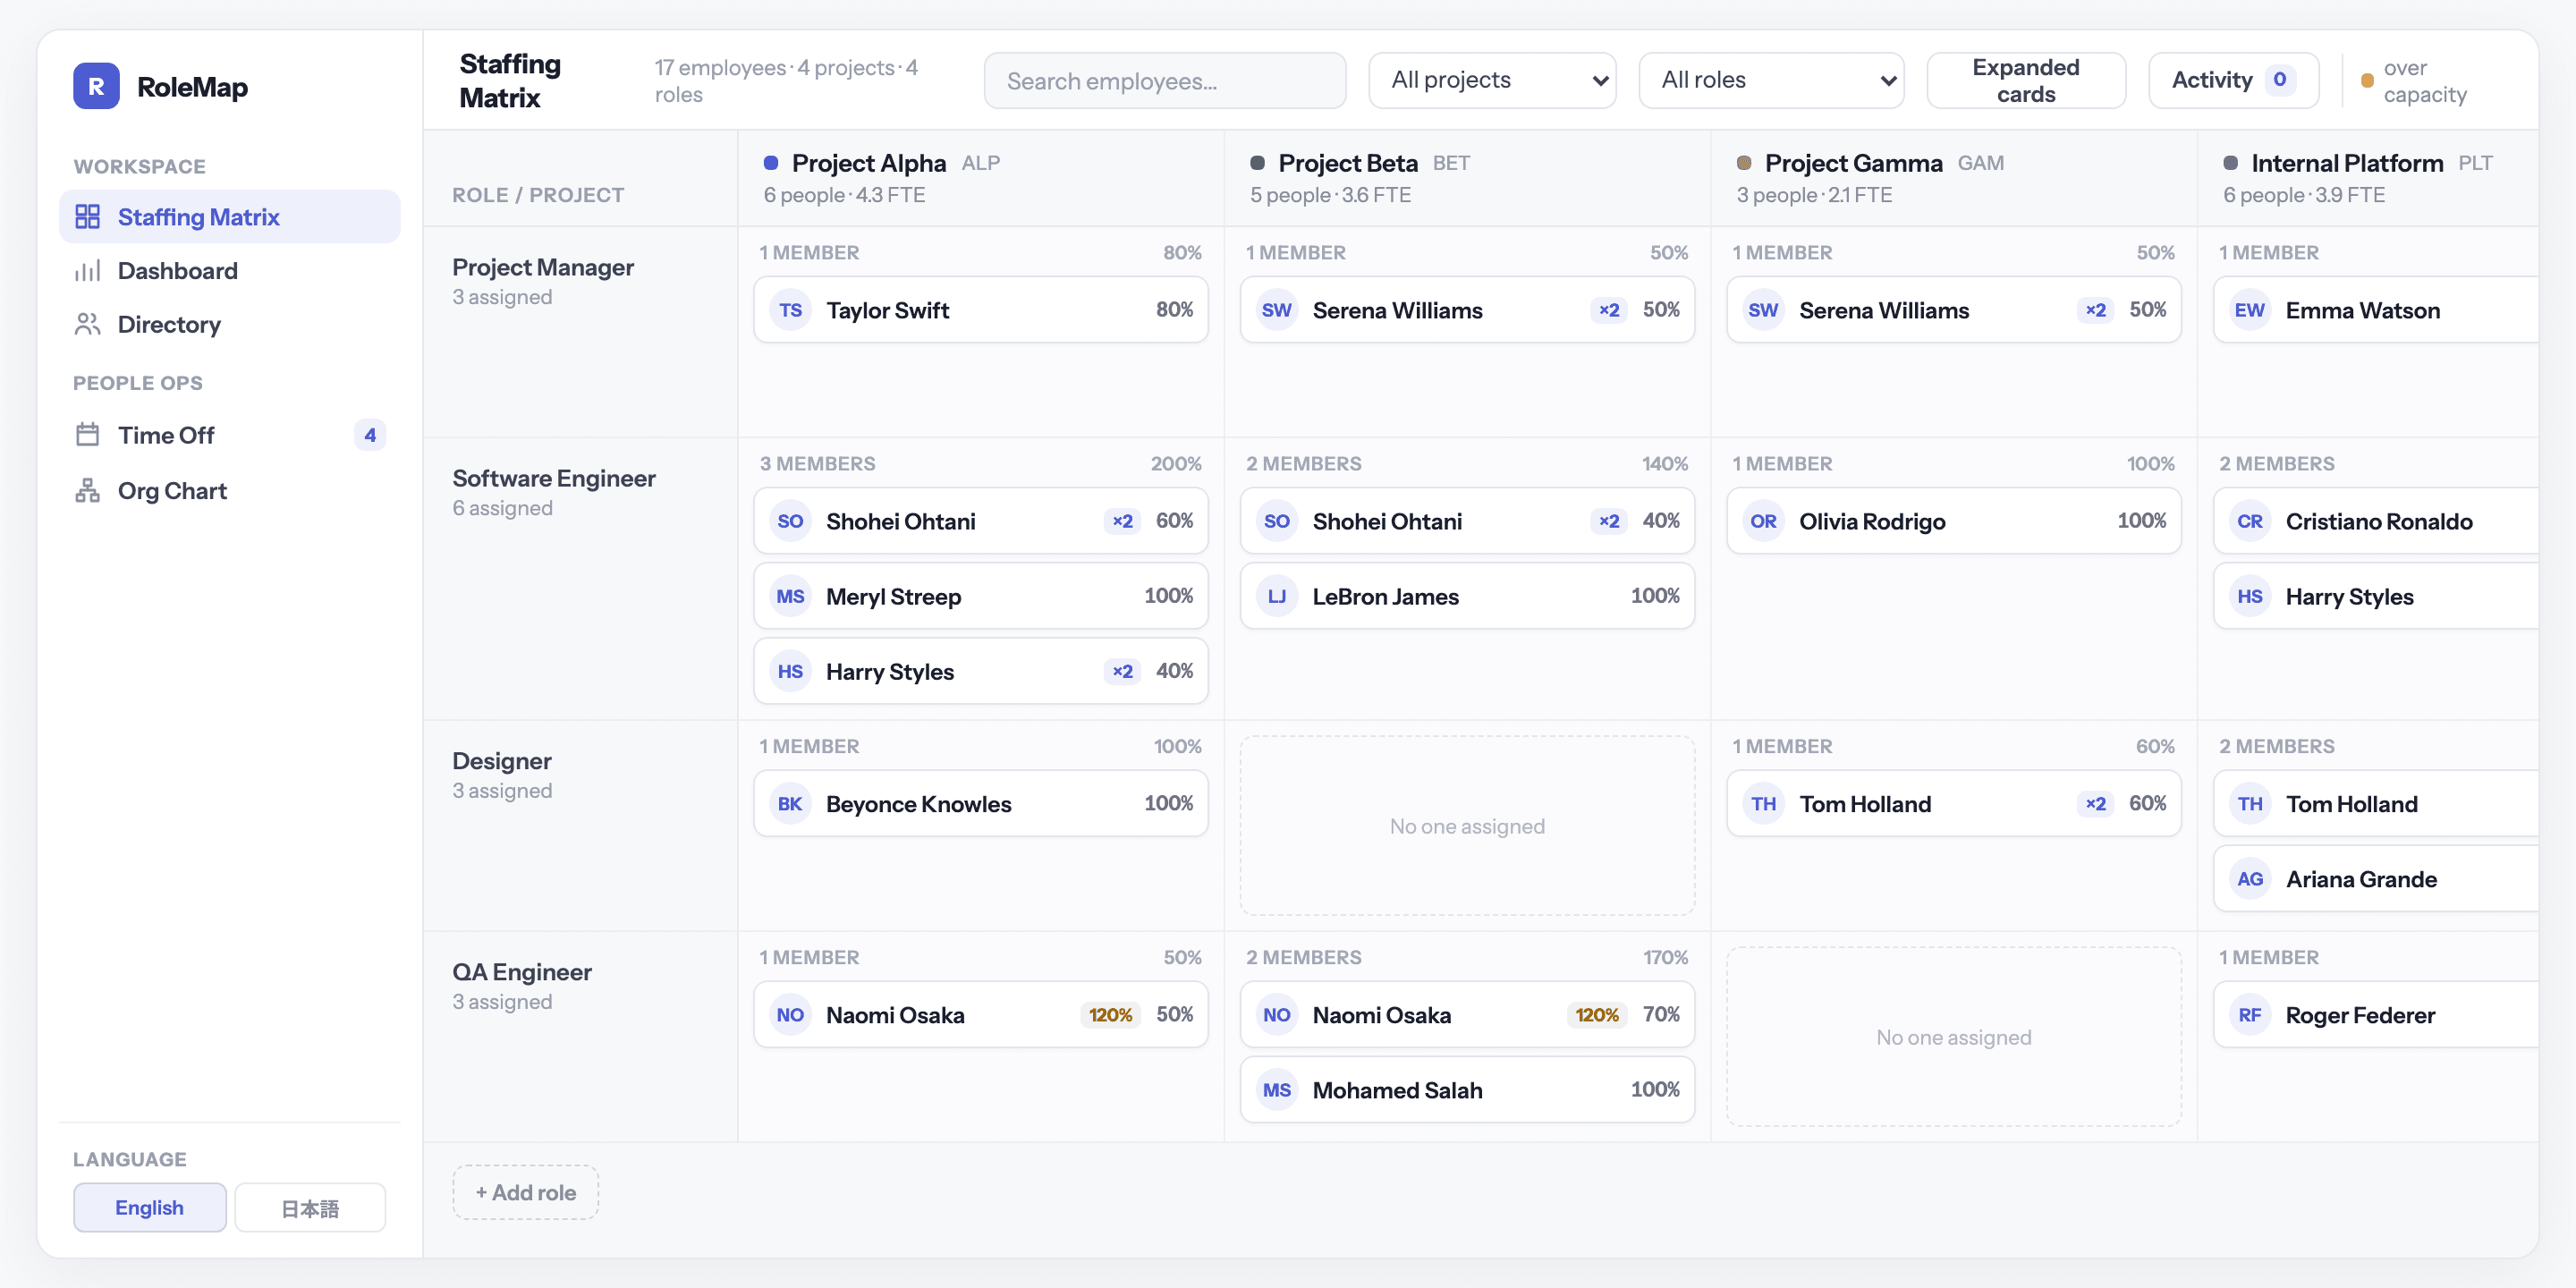
Seventeen people, four projects, four roles, laid out as a matrix where every assignment sits in the cell its project and role meet. Allocation totals are computed rather than typed, skills are scored so gaps show up as gaps, and time off feeds the same picture as staffing. The client got back the hours they had been spending reconciling a workbook, and a plan the whole team could read. The screens here run on stand-in data, with real names and project names replaced.
The problem
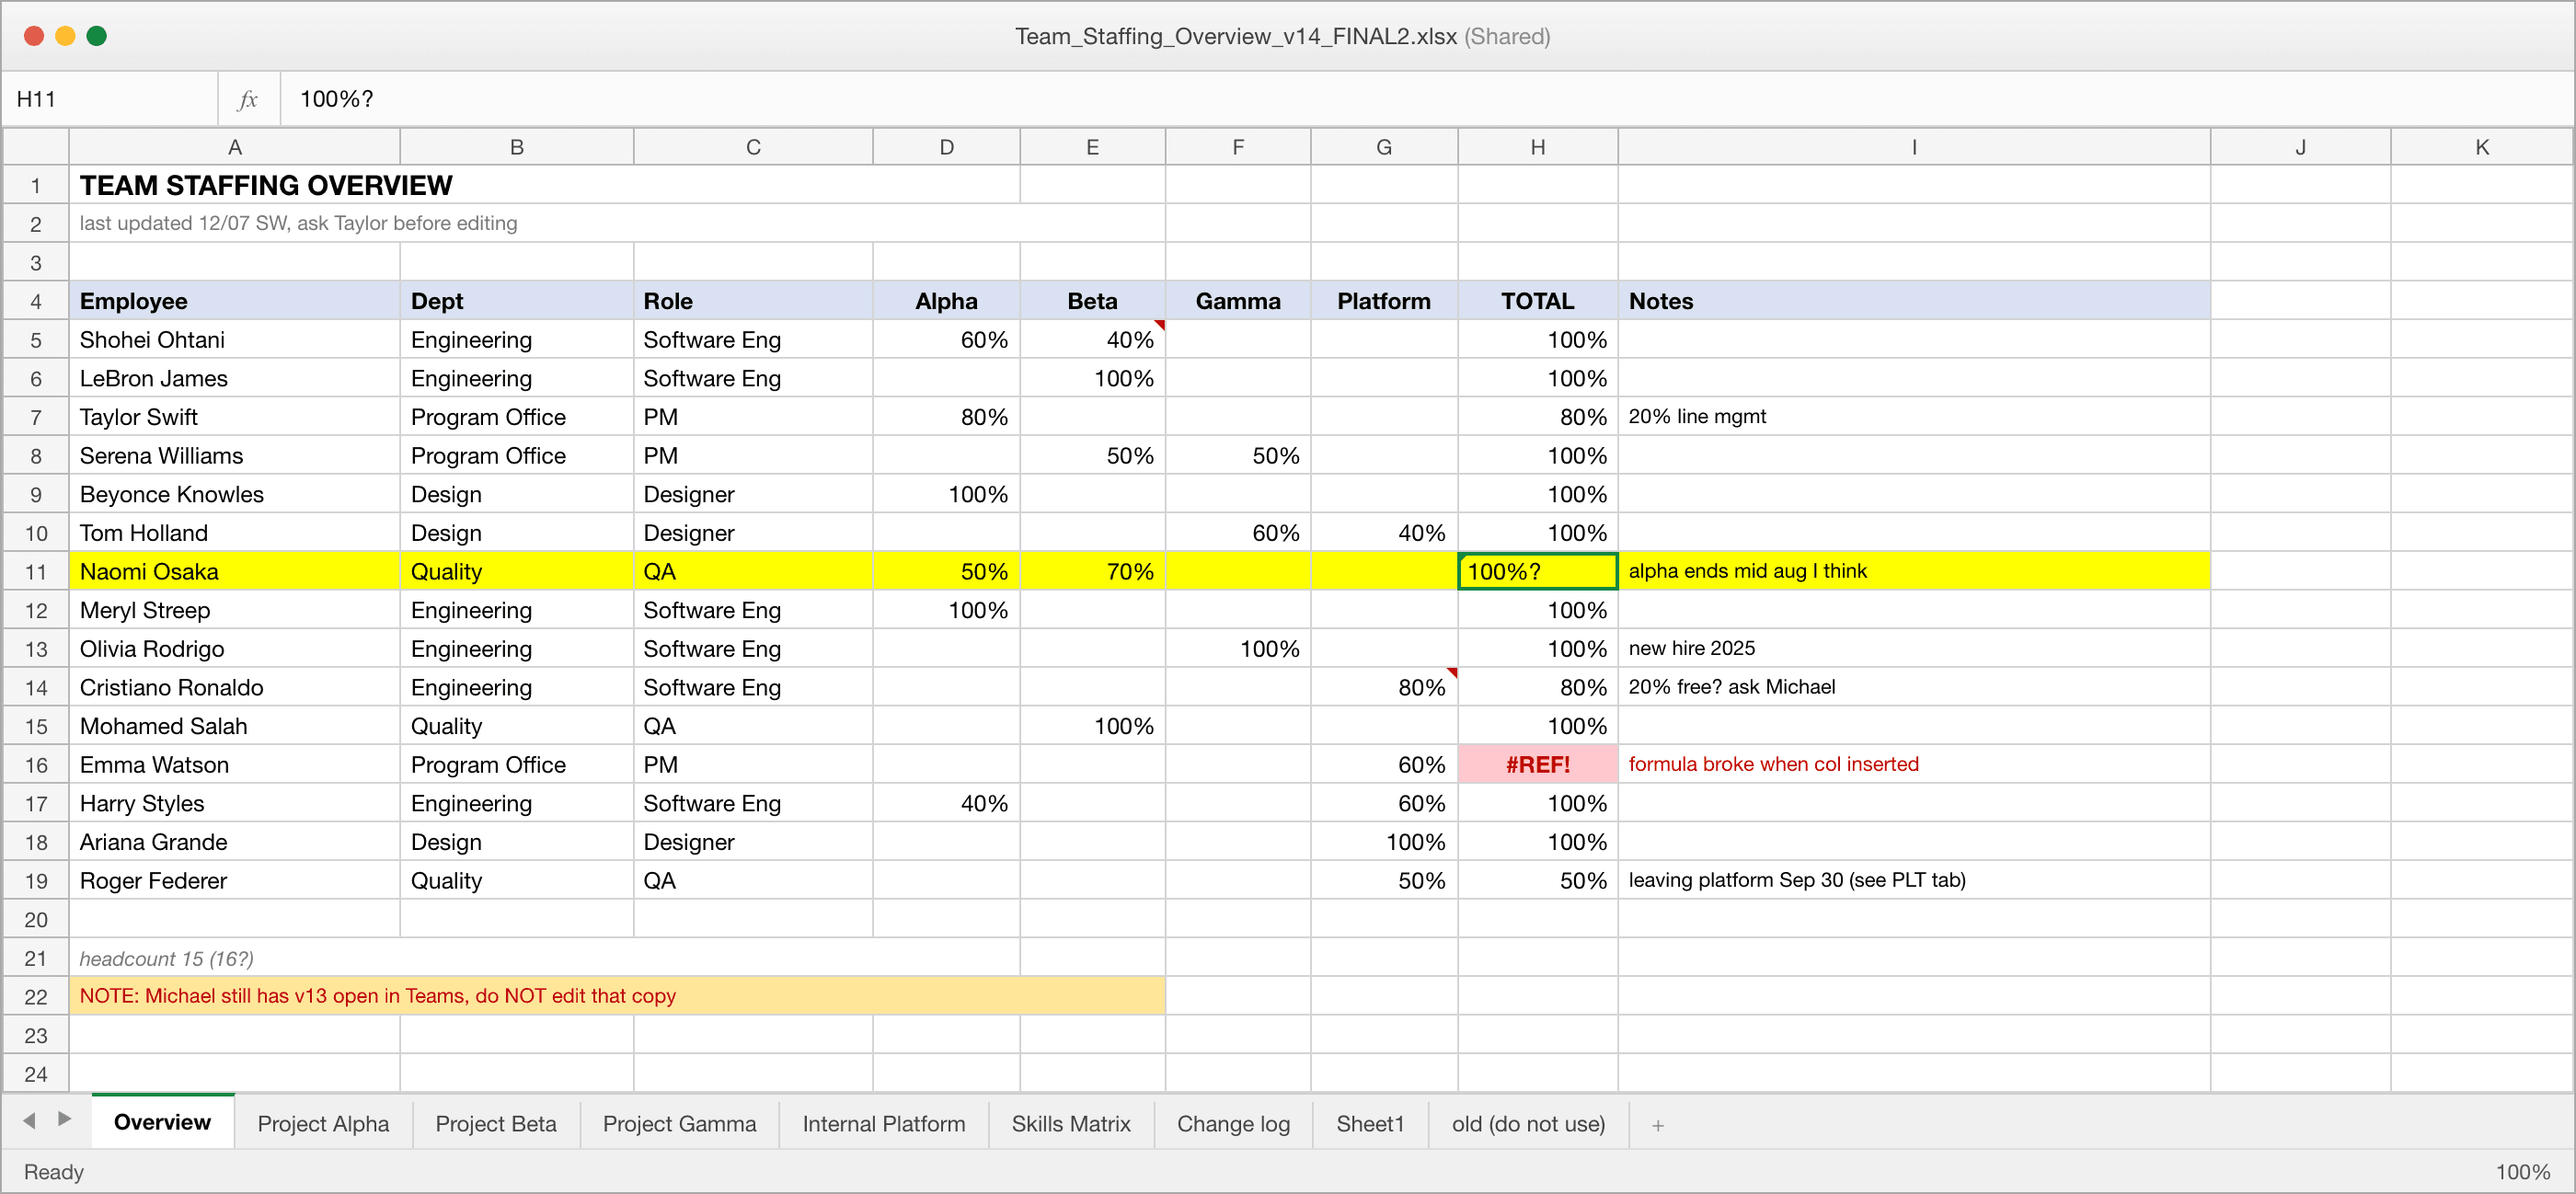
The team ran staffing out of one shared workbook, and it failed the same way every time. The same person appeared on three tabs with three different percentages. Someone inserted a column and half the totals turned into errors. Skills were recorded as “good” or “needs work”. A person was rolling off in two weeks and that fact lived in a cell comment nobody read. The workbook we started from had a change log whose last entry read “not written down anywhere”.
In the workbook
- The same person duplicated across project tabs with conflicting percentages
- Allocation totals typed by hand, and broken formulas where a column was inserted
- Skills kept as free text, so nobody could see where the team was thin
- Roll-off dates and time off living in cell comments and mail threads
In the platform
- One record per person, project and role, so the totals add up on their own
- Anyone over 100% flags immediately, before a project manager finds out the hard way
- Skills scored 1 to 5 and rolled up per team, with the gaps called out
- Every change writes to an activity log instead of disappearing
What We Did
Capacity at a glance
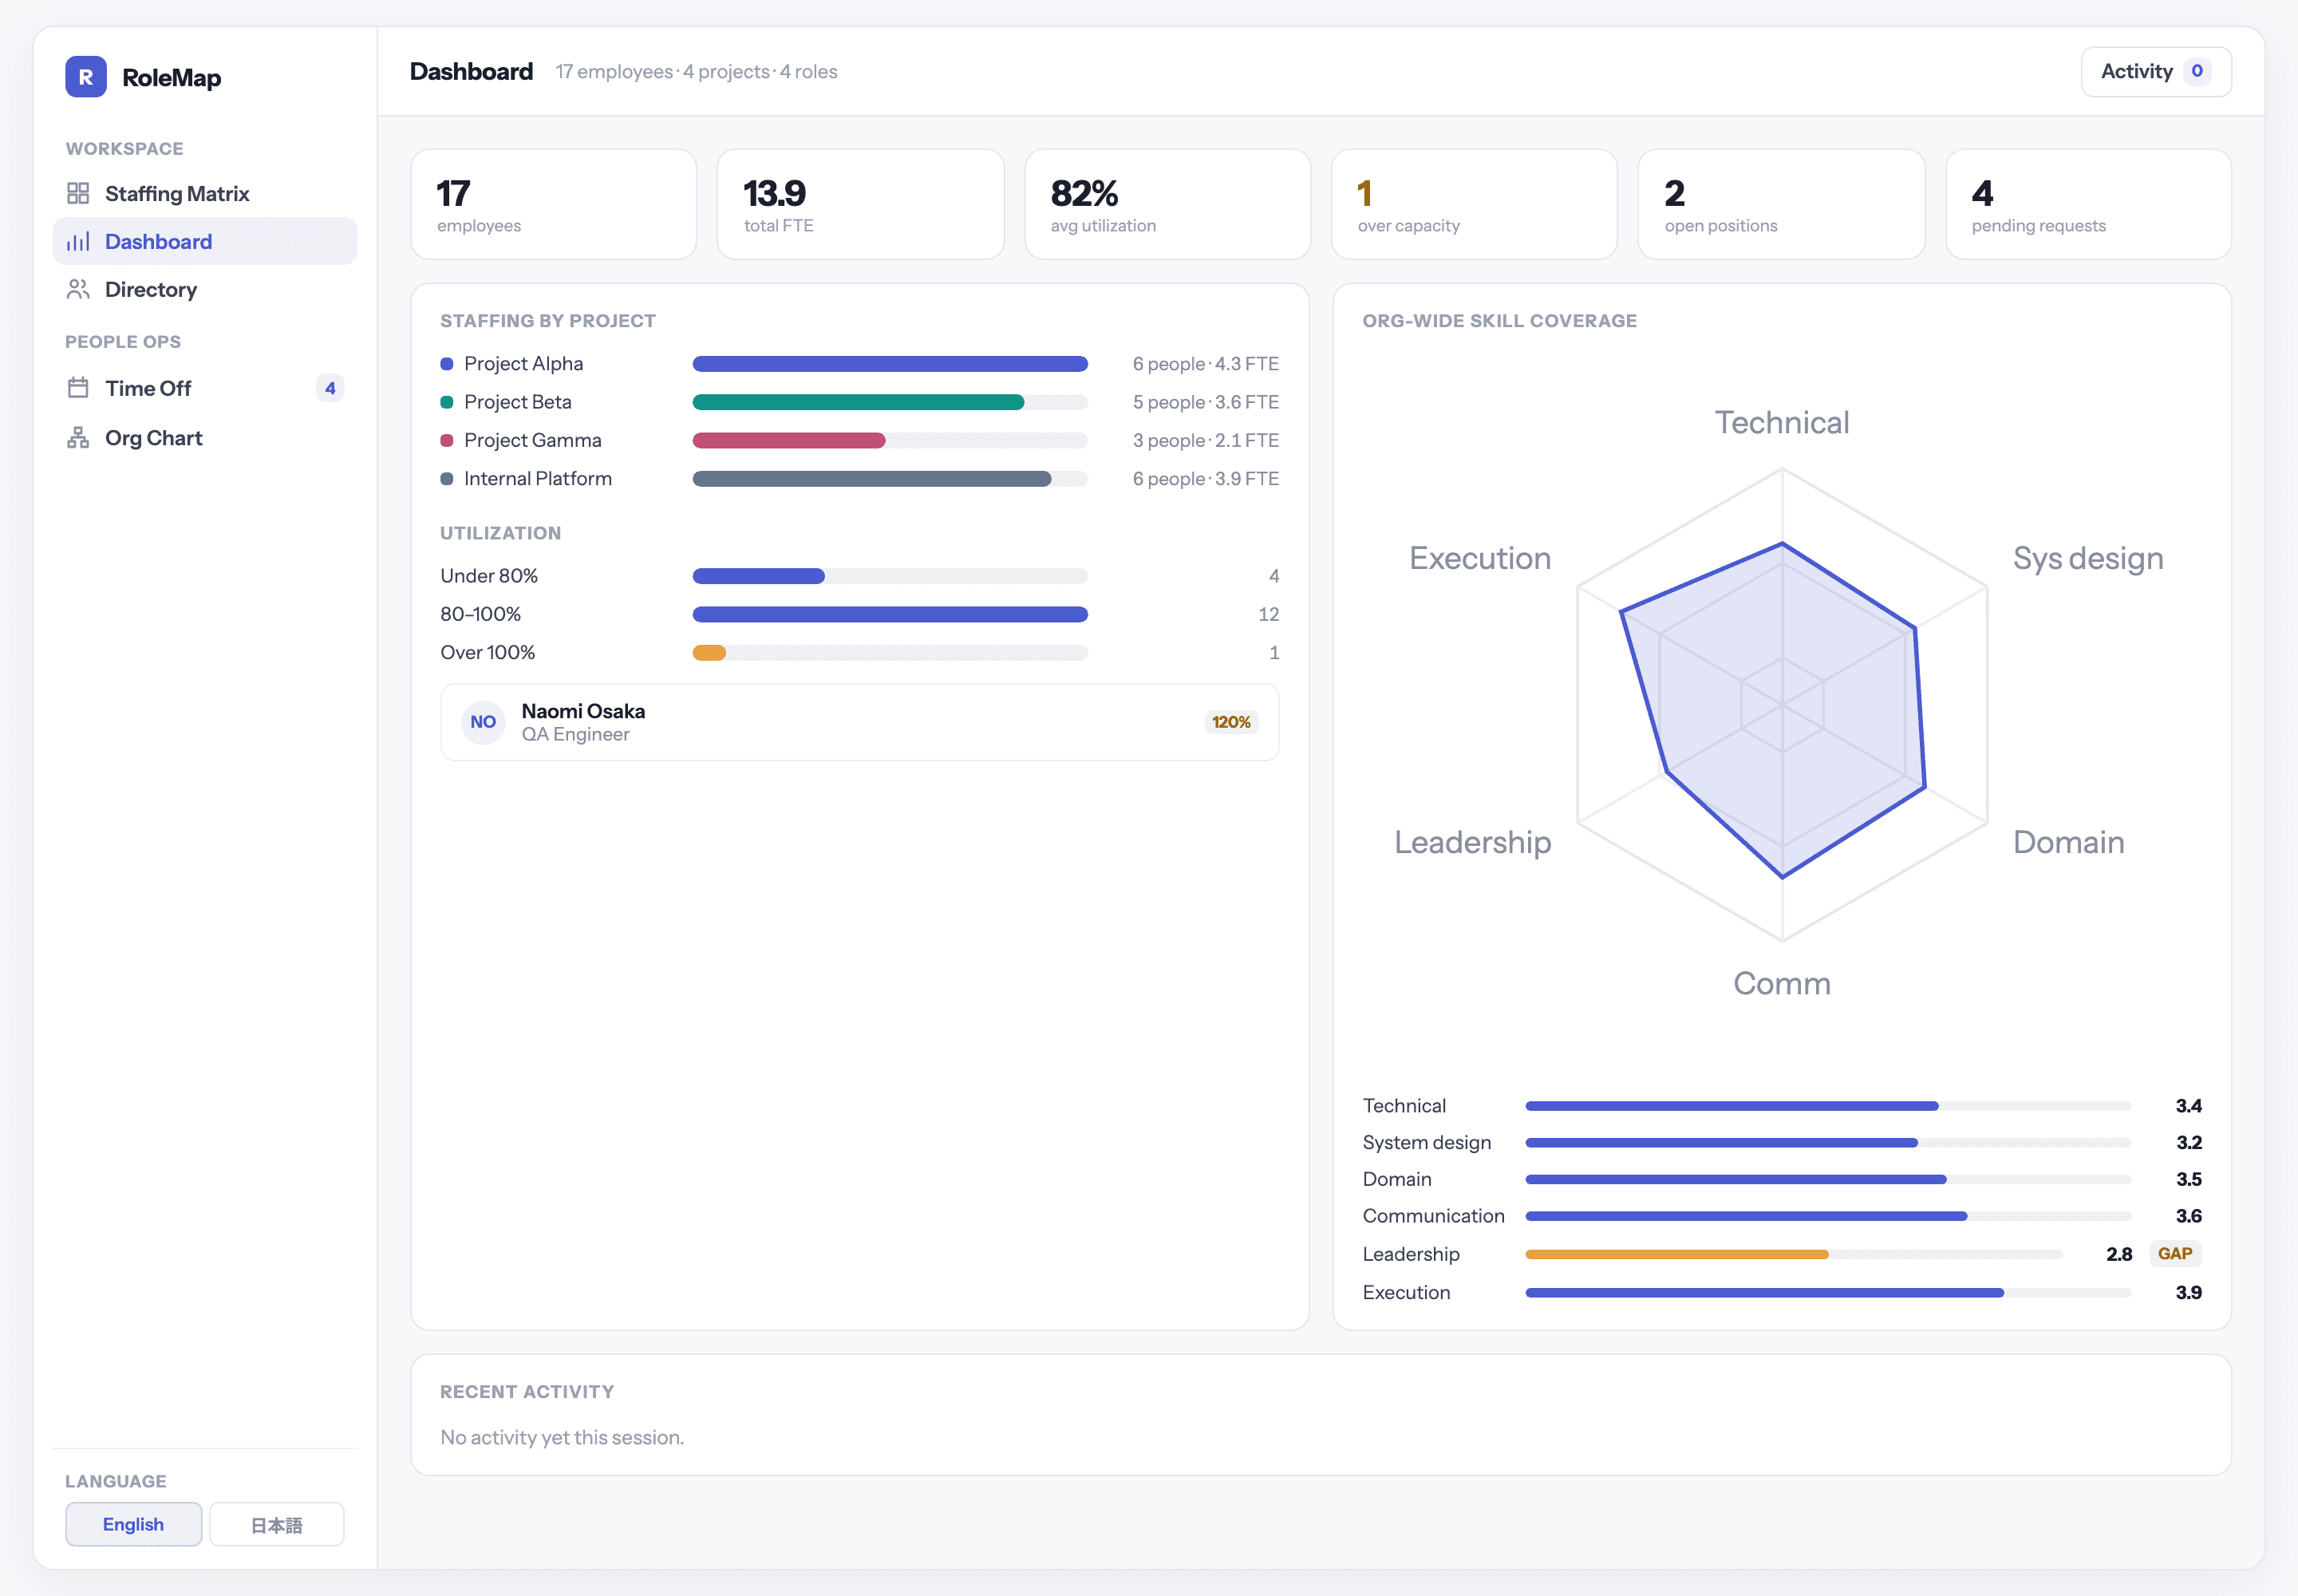
Headcount, total FTE, average utilisation and anyone over capacity, next to an org-wide skill radar. Open positions and pending time-off requests sit in the same header, so a planning conversation can start and finish on one screen.
Skill coverage per team
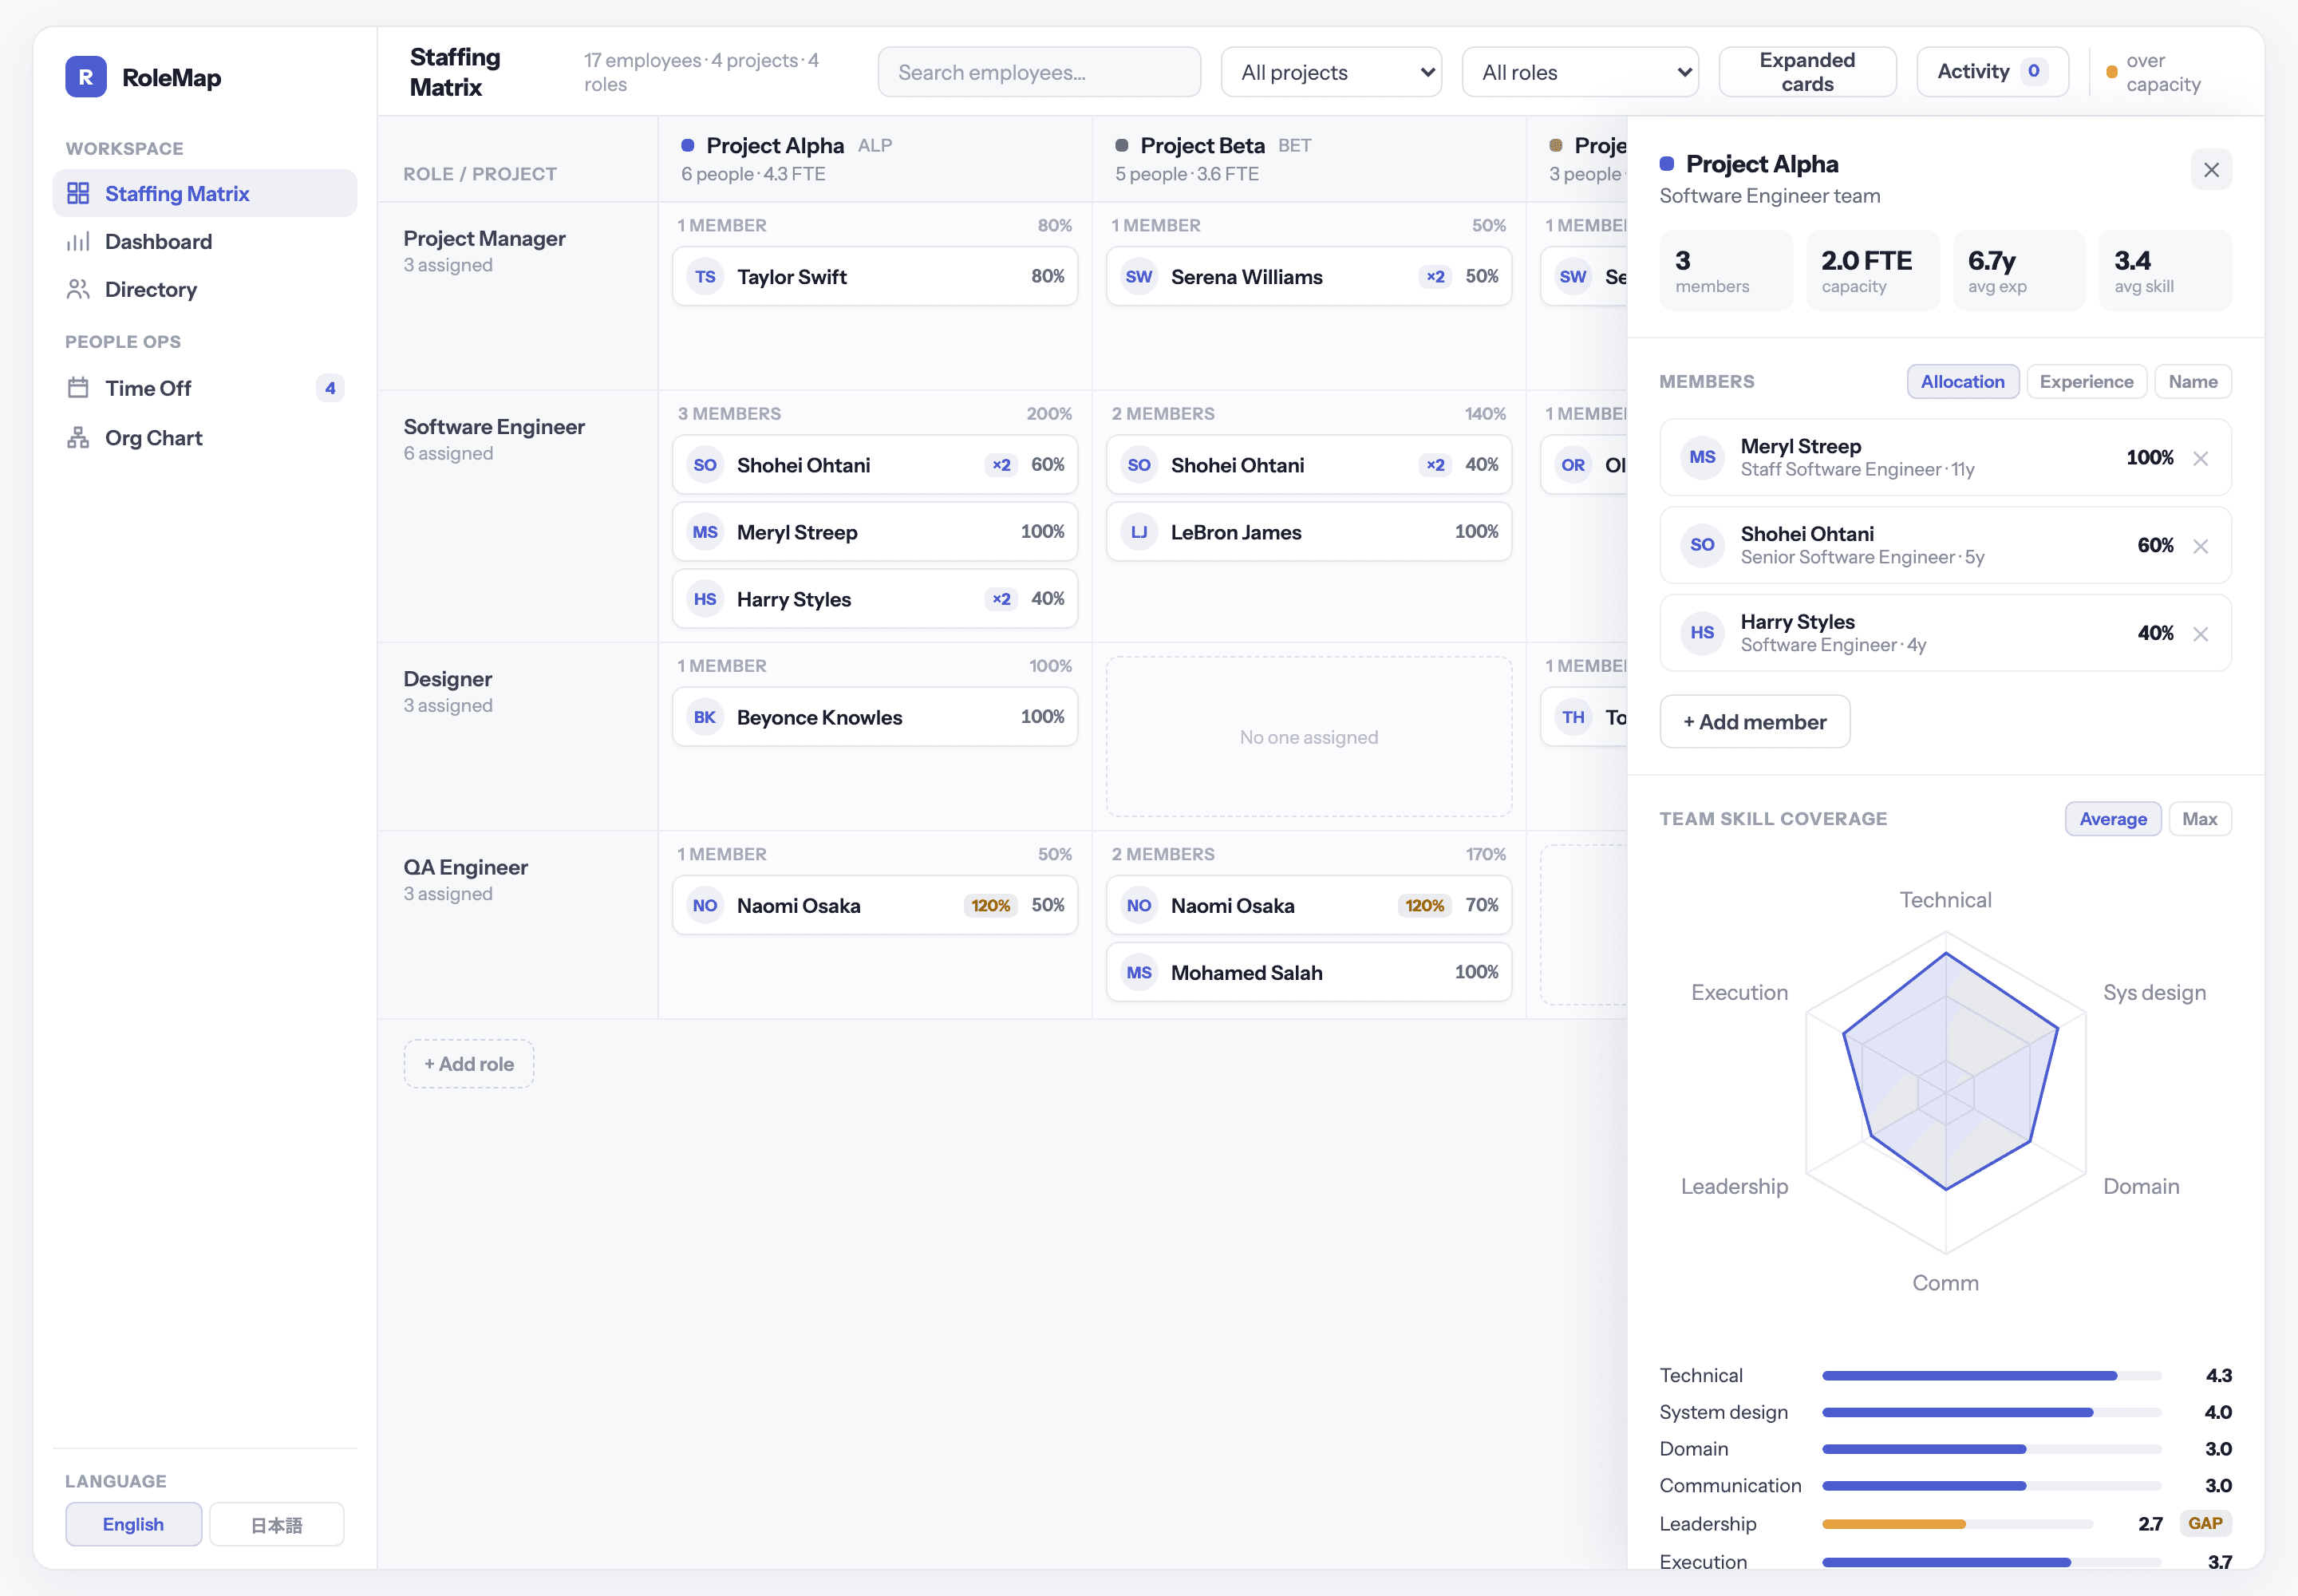
Pick a team and see its members, average experience and a skill radar aggregated across everyone in it. Anything below 3.0 gets a gap badge, which turns “we should probably hire” into a specific role and a specific skill.
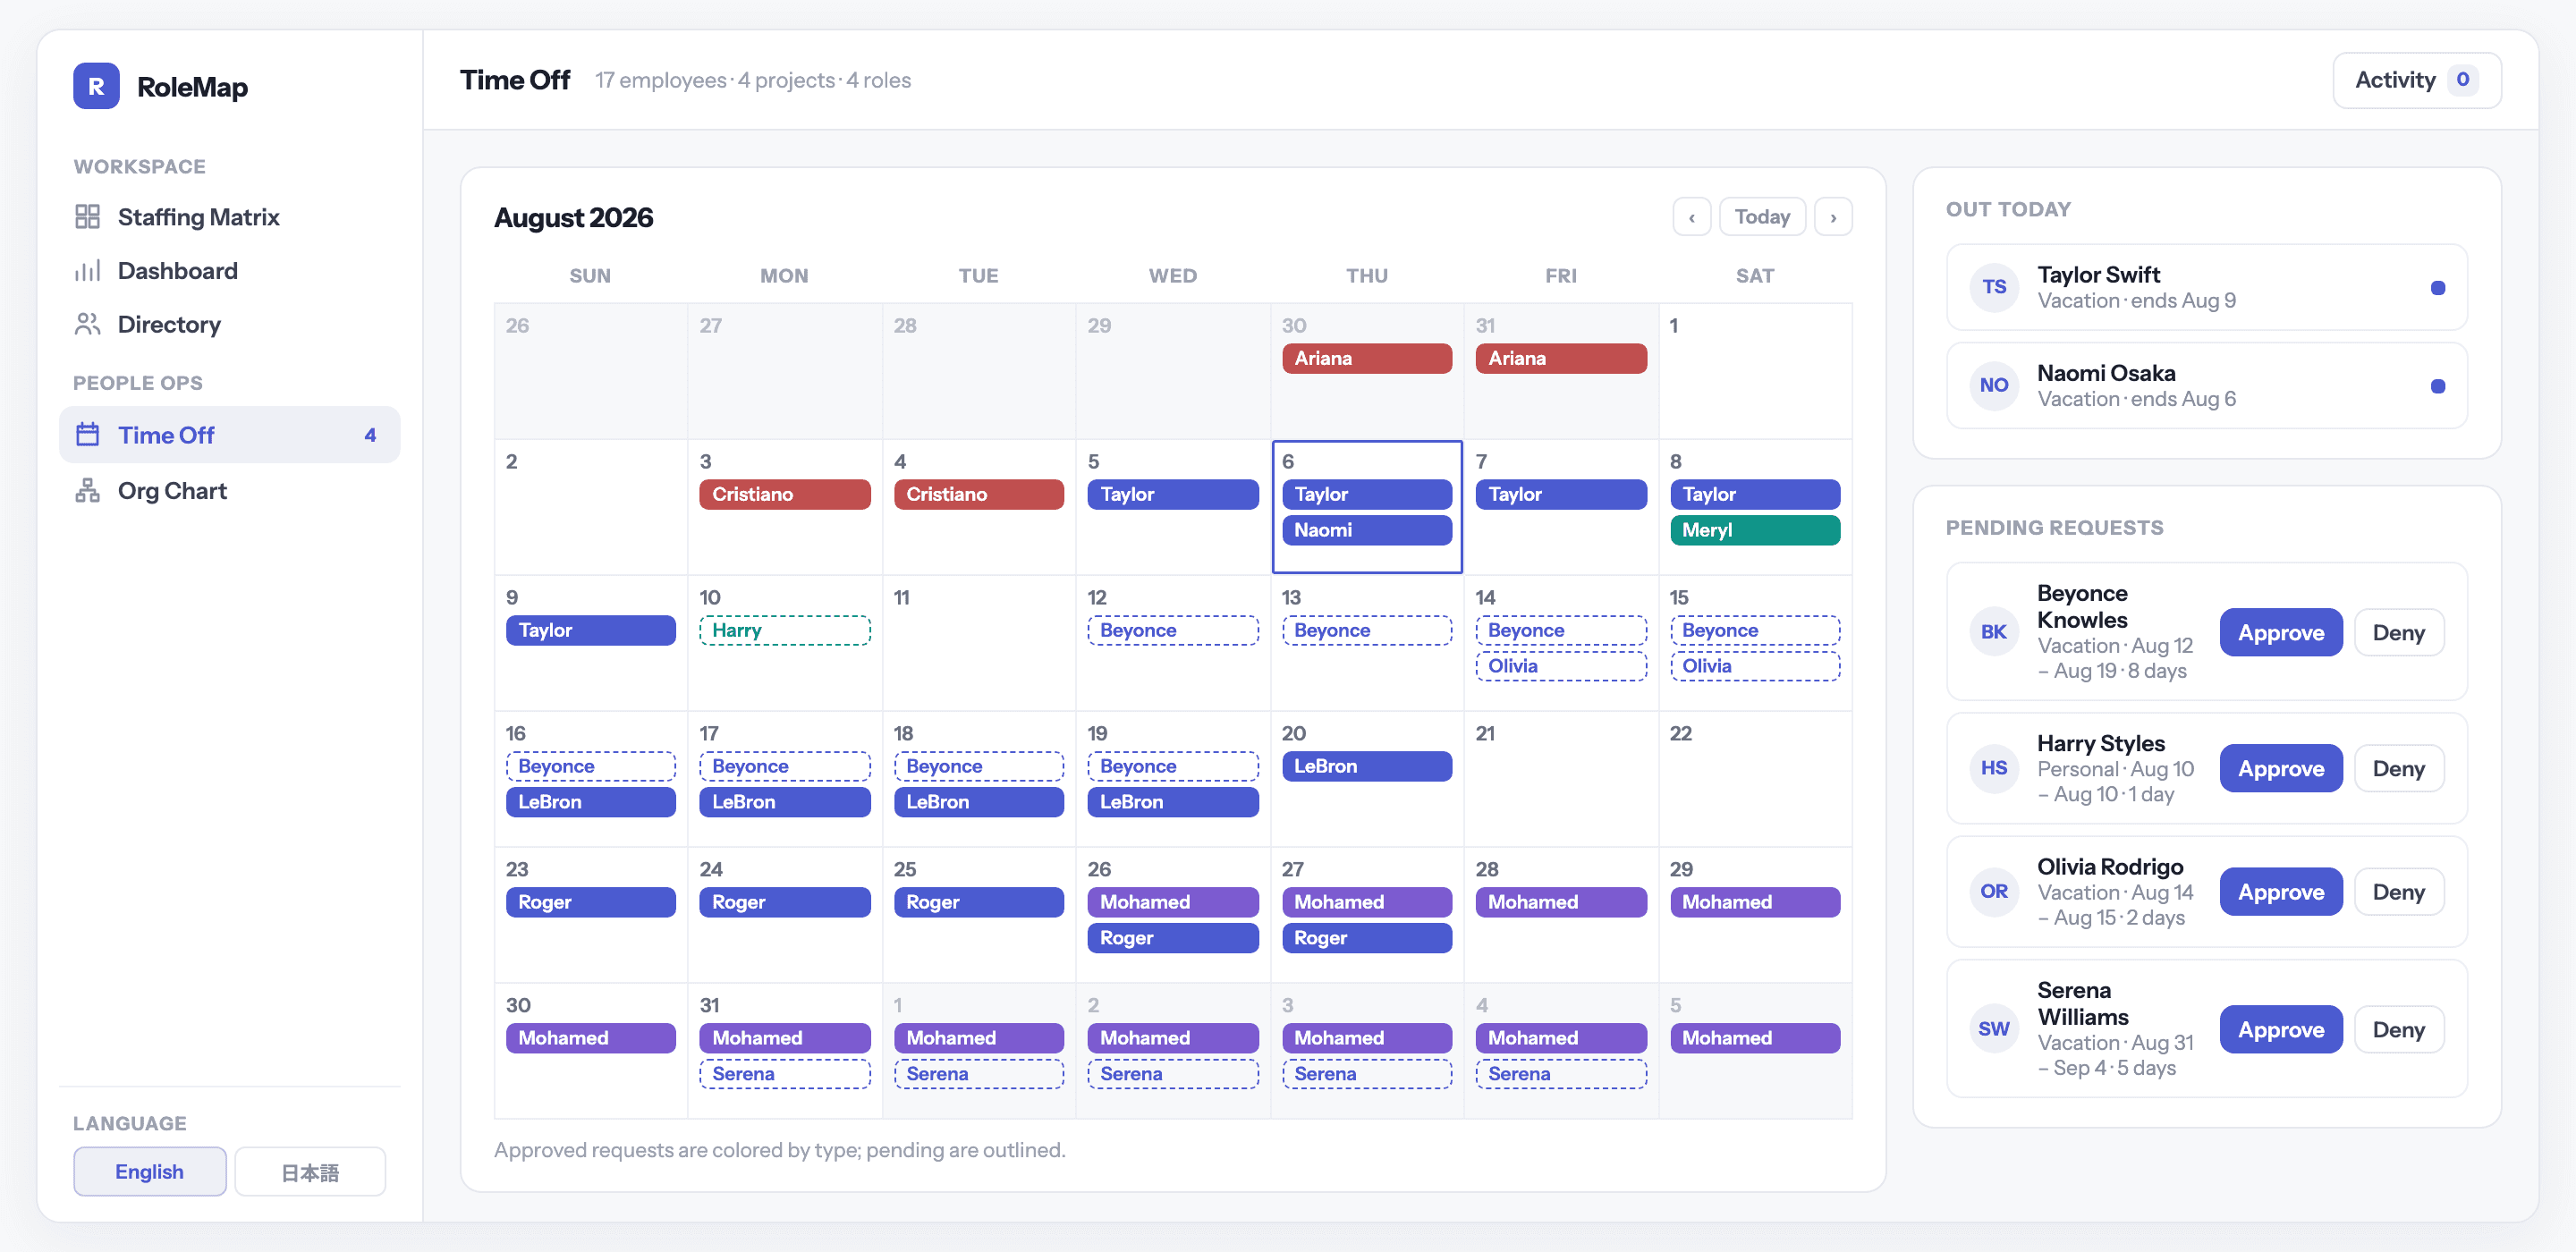
Time off that affects the plan
A month calendar coloured by leave type, with the approval queue next to it. Approving a request updates the calendar, the sidebar count and the activity log at once, so availability and staffing stay part of the same conversation.
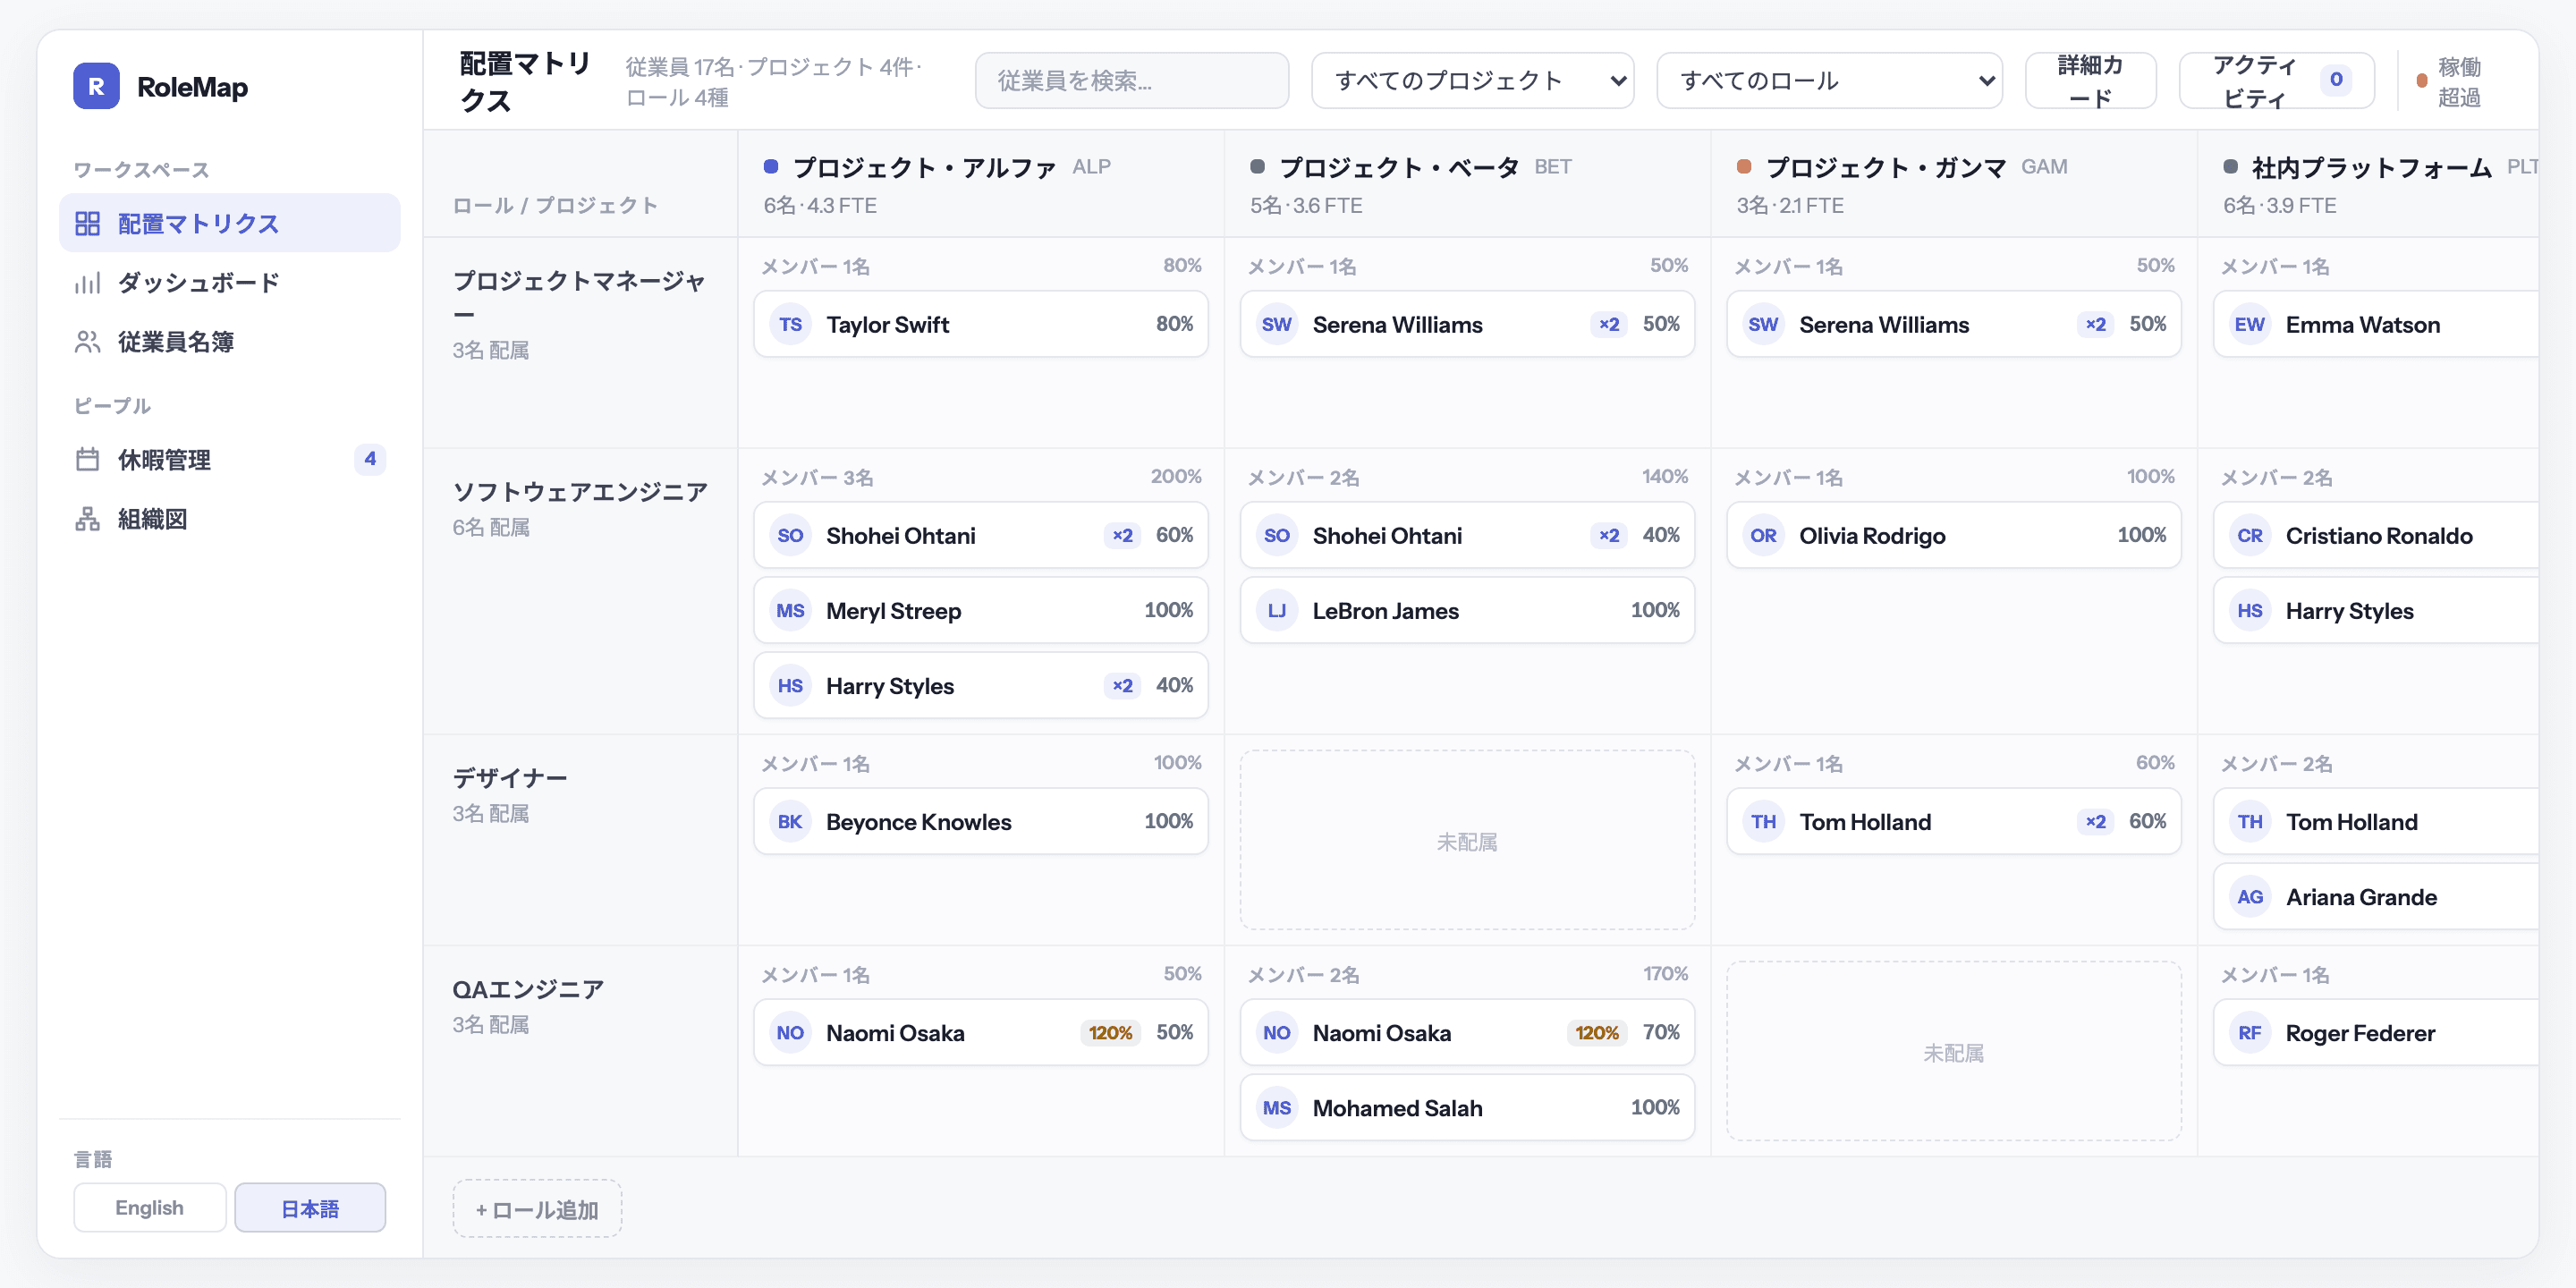
The same matrix in Japanese
Roles, projects, statuses and counters all have Japanese equivalents, switched from the sidebar. Dates and number formats follow the locale rather than being translated word for word.